- $tar -xf chartdir_python_linux_64.tar.gz
- $cd ChartDirector/
- $ipython3 -c "import sys; print(sys.path)"
- // Or
- $ipython3
- >>import sys
- >> print(sys)
- ['/home/elimboto/.local/bin', '/usr/lib/python36.zip', '/usr/lib/python3.6', '/usr/lib/python3.6/lib-dynload', '', '/home/elimboto/.local/lib/python3.6/site-packages', '/usr/local/lib/python3.6/dist-packages', '/usr/lib/python3/dist-packages', '/home/elimboto/.local/lib/python3.6/site-packages/IPython/extensions', '/home/elimboto/.ipython']
- :~/Desktop/ChartDirector$ cd /usr/local/lib/python3.6/dist-packages
- $sudo mkdir chartdirector
- $ cd chartdirector/
- $pwd
- /usr/local/lib/python3.6/dist-packages/chartdirector
- $ cd //Move to the directory where the ChartDirectory is downloaded, in this case Desktop
- $:~/Desktop$ cd ChartDirector/lib/
- $ sudo cp -a ./* /usr/local/lib/python3.6/dist-packages/chartdirector/
- $ cd /usr/local/lib/python3.6/dist-packages/
-
- Active Topics
-
-
- by
 Eli 1 day ago All in One: YouTube, TED, X, Facebook and Instagram Reels, Videos, Images and Text Posts View the latest post Replies 332 Views 40580
 - by Eli 1 day ago Iran's President Ebrahim Raisi Aged 63 Dies in a Helicopter Crash View the latest post Replies 3 Views 63
- by Eli 1 day ago Re: What is in Your Mind? View the latest post Replies 717 Views 307364
- by Eli 3 days ago PySpark for Large Data Processing View the latest post Replies 2 Views 8172
- by Eli 3 days ago Online Bible View the latest post Replies 3 Views 23331
- by Eli 4 days ago Generating SSH Key and Adding it to the ssh-agent for Authentication on GitHub View the latest post Replies 1 Views 491
- by Eli 1 week ago Russia Invades Ukraine View the latest post Replies 663 Views 241186
- by Eli 2 weeks ago President Museveni's Speech During International Development Association (IDA) Summit View the latest post Replies 1 Views 509
- by Eli 2 weeks ago From Simple Linear Regression Analysis to Covariance & Correlation to Independent Determinant, and R-Squared View the latest post Replies 11 Views 25145
- by Eli 2 weeks ago Collection of Greatest Christian Hymns of all Times View the latest post Replies 34 Views 72726
- by
-
Installing the ChartDirector for Python on Ubuntu Linux and Demo to Create 3D Pie Charts
-
Eli

- Senior Expert Member
- Reactions: 183
- Posts: 5410
- Joined: 9 years ago
- Location: Tanzania
- Has thanked: 75 times
- Been thanked: 88 times
- Contact:
Below are step-by-step instructions for Installing the ChartDirector for Python 3.6.x on Ubuntu Linux. First, download the appropriate version from here (currently this one) and then follow the instructions below:
0
TSSFL -- A Creative Journey Towards Infinite Possibilities!
-
Eli
- Senior Expert Member
- Reactions: 183
- Posts: 5410
- Joined: 9 years ago
- Location: Tanzania
- Has thanked: 75 times
- Been thanked: 88 times
- Contact:
And then one can run the following codes.
Below are a number of sample codes (taken from here with some modifications) to create pie charts using ChartDirector 7.0 (Python Edition).
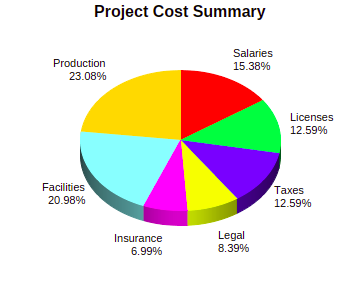
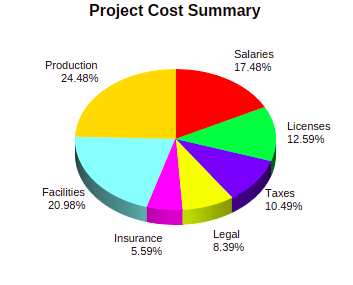
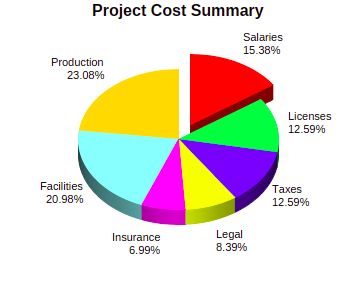
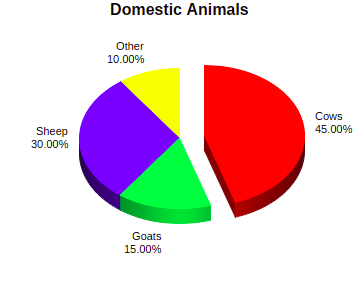
3D Pie Chart
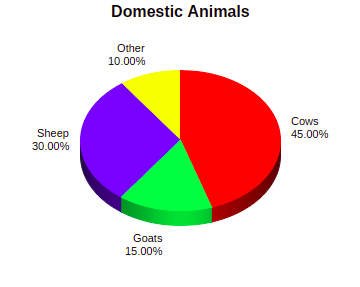
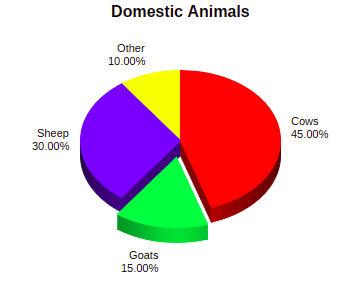
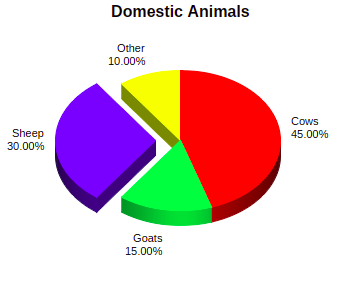
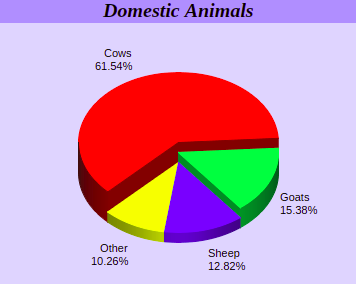
Multi-Depth Pie Chart
Icon Pie Chart
Pie Chart with Weather Icons
Under this case, you can as well omit icons.
Pie Chart with Emoji Icons
See all these and more at ChartDirector 7.0 (Python Edition), Pie Chart Gallery, and ChartDirector website
Below are a number of sample codes (taken from here with some modifications) to create pie charts using ChartDirector 7.0 (Python Edition).
3D Pie Chart
- #!/usr/bin/python
- # https://www.advsofteng.com/doc/cdpydoc/threedpie.htm
- #https://www.796t.com/article.php?id=139934
- # The ChartDirector for Python module is assumed to be in "../lib"
- import sys, os
- #sys.path.insert(0,"/usr/local/lib/python3.6/dist-packages")
- sys.path.insert(0, os.path.join(os.path.abspath(sys.path[0]), "..", "/usr/local/lib/python3.6/dist-packages/chartdirector"))
- from pychartdir import *
- # The data for the pie chart
- data = [22, 18, 18, 12, 10, 30, 33]
- # The labels for the pie chart
- labels = ["Salaries", "Licenses", "Taxes", "Legal", "Insurance", "Facilities", "Production"]
- # Create a PieChart object of size 360 x 300 pixels
- c = PieChart(360, 300)
- # Set the center of the pie at (180, 140) and the radius to 100 pixels
- c.setPieSize(180, 140, 100)
- # Add a title to the pie chart
- c.addTitle("Project Cost Summary")
- # Draw the pie in 3D
- c.set3D()
- # Set the pie data and the pie labels
- c.setData(data, labels)
- # Explode the 1st sector (index = 0)
- c.setExplode(0)
- # Output the chart
- c.makeChart("Image.png")
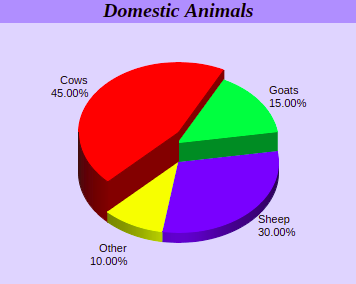
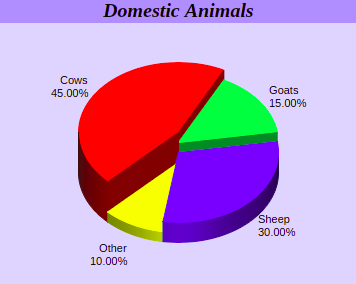
Multi-Depth Pie Chart
- #!/usr/bin/python
- # The ChartDirector for Python module is assumed to be in "../lib"
- import sys, os
- sys.path.insert(0, os.path.join(os.path.abspath(sys.path[0]), "..", "/usr/local/lib/python3.6/dist-packages/chartdirector"))
- from pychartdir import *
- # The data for the pie chart
- data = [72, 18, 15, 12]
- #data = [45, 15, 30, 10]
- # The labels for the pie chart
- #labels = ["Labor", "Machinery", "Facilities", "Computers"]
- labels = ['Cows', 'Goats', 'Sheep', 'Other']
- # The depths for the sectors
- depths = [30, 20, 10, 10]
- # Create a PieChart object of size 360 x 300 pixels, with a light blue (DDDDFF) background and a 1
- # pixel 3D border
- c = PieChart(360, 300, 0xddddff, -1, 1)
- # Set the center of the pie at (180, 175) and the radius to 100 pixels
- c.setPieSize(180, 175, 100)
- # Add a title box using 15pt Times Bold Italic font and blue (AAAAFF) as background color
- c.addTitle("Domestic Animals", "Times New Roman Bold Italic", 15).setBackground(0xaaaaff)
- # Set the pie data and the pie labels
- c.setData(data, labels)
- # Draw the pie in 3D with variable 3D depths
- c.set3D2(depths)
- # Set the start angle to 225 degrees may improve layout when the depths of the sector are sorted in
- # descending order, because it ensures the tallest sector is at the back.
- c.setStartAngle(225)
- # Output the chart
- c.makeChart("multidepth_pie_chart.png")
Icon Pie Chart
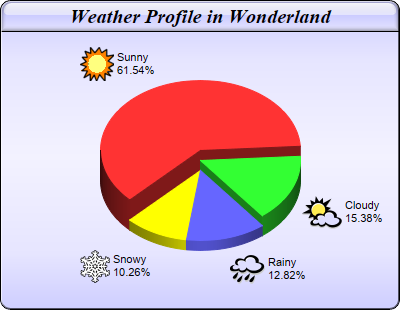
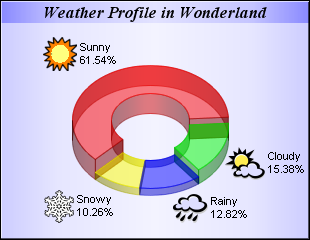
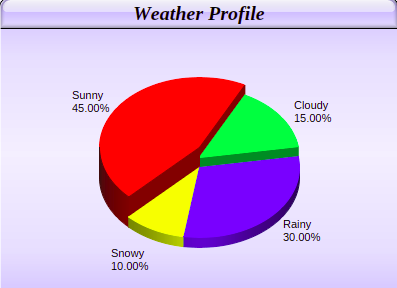
Pie Chart with Weather Icons
Under this case, you can as well omit icons.
- #!/usr/bin/python
- # The ChartDirector for Python module is assumed to be in "../lib"
- import sys, os
- sys.path.insert(0, os.path.join(os.path.abspath(sys.path[0]), "..", "/usr/local/lib/python3.6/dist-packages/chartdirector"))
- from pychartdir import *
- # The data for the pie chart
- #data = [72, 18, 15, 12]
- data = [45, 15, 30, 10]
- # The depths for the sectors
- depths = [30, 20, 10, 10]
- # The labels for the pie chart
- labels = ["Sunny", "Cloudy", "Rainy", "Snowy"]
- # The icons for the sectors
- icons = ["sun.png", "cloud.png", "rain.png", "snowy.png"]
- # Create a PieChart object of size 400 x 310 pixels, with a blue (CCCCFF) vertical metal gradient
- # background, black border, 1 pixel 3D border effect and rounded corners
- c = PieChart(400, 310, metalColor(0xccccff, 0), 0x000000, 1)
- c.setRoundedFrame()
- # Set the center of the pie at (200, 180) and the radius to 100 pixels
- c.setPieSize(200, 180, 100)
- # Add a title box using 15pt Times Bold Italic font, on a blue (CCCCFF) background with glass effect
- c.addTitle("Weather Profile", "Times New Roman Bold Italic", 15).setBackground(
- 0xccccff, 0x000000, glassEffect())
- # Set the pie data and the pie labels
- c.setData(data, labels)
- # Add icons to the chart as a custom field
- c.addExtraField(icons)
- # Configure the sector labels using CDML to include the icon images
- c.setLabelFormat("<*block,valign=absmiddle*><*img={field0}*> <*block*>{label}\n{percent}%<*/*><*/*>"
- )
- # Draw the pie in 3D with variable 3D depths
- c.set3D2(depths)
- # Set the start angle to 225 degrees may improve layout when the depths of the sector are sorted in
- # descending order, because it ensures the tallest sector is at the back.
- c.setStartAngle(225)
- # Output the chart
- c.makeChart("weathericon_piechart.png")
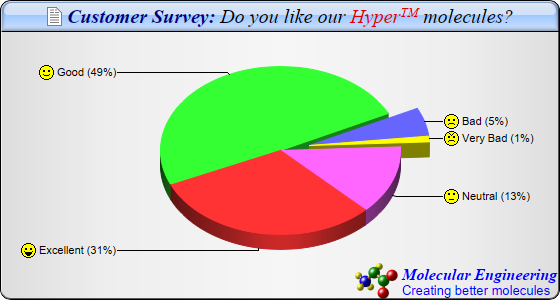
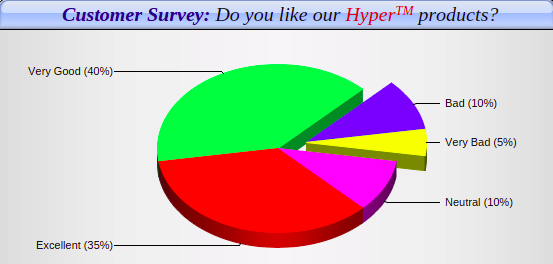
Pie Chart with Emoji Icons
- #!/usr/bin/python
- # The ChartDirector for Python module is assumed to be in "../lib"
- import sys, os
- sys.path.insert(0, os.path.join(os.path.abspath(sys.path[0]), "..", "/usr/local/lib/python3.6/dist-packages/chartdirector"))
- from pychartdir import *
- # The data for the pie chart
- data = [35, 40, 10, 5, 10]
- # The labels for the pie chart
- labels = ["Excellent", "Very Good", "Bad", "Very Bad", "Neutral"]
- # The icons for the sectors
- icons = ["laugh.png", "smile.png", "sad.png", "angry.png", "nocomment.png"]
- # Create a PieChart object of size 560 x 300 pixels, with a silver background, black border, 1 pxiel
- # 3D border effect and rounded corners
- c = PieChart(560, 300, silverColor(), 0x000000, 1)
- c.setRoundedFrame()
- # Set the center of the pie at (280, 150) and the radius to 120 pixels
- c.setPieSize(280, 150, 120)
- # Add a title box with title written in CDML, on a sky blue (A0C8FF) background with glass effect
- c.addTitle(
- "<*block,valign=absmiddle*><*img=doc.png*> Customer Survey: <*font=Times New Roman " \
- "Italic,color=000000*>Do you like our <*font,color=dd0000*>Hyper<*super*>TM<*/font*> " \
- "products?", "Times New Roman Bold Italic", 15, 0x000080).setBackground(0xa0c8ff, 0x000000,
- glassEffect())
- # Add a logo to the chart written in CDML as the bottom title aligned to the bottom right
- c.addTitle2(BottomRight,
- "<*block,valign=absmiddle*><*img=molecule.png*> <*block*><*color=FF*><*font=Times New Roman " \
- "Bold Italic,size=12*>Molecular Engineering\n<*font=Arial,size=10*>Creating better molecules")
- # Set the pie data and the pie labels
- c.setData(data, labels)
- # Set 3D style
- c.set3D()
- # Use the side label layout method
- c.setLabelLayout(SideLayout)
- # Set the label background color to transparent
- c.setLabelStyle().setBackground(Transparent)
- # Add icons to the chart as a custom field
- c.addExtraField(icons)
- # Configure the sector labels using CDML to include the icon images
- c.setLabelFormat("<*block,valign=absmiddle*><*img={field0}*> {label} ({percent|0}%)")
- # Explode the 3rd and 4th sectors as a group (index = 2 and 3)
- c.setExplodeGroup(2, 3)
- # Set the start angle to 135 degrees may improve layout when there are many small sectors at the end
- # of the data array (that is, data sorted in descending order). It is because this makes the small
- # sectors position near the horizontal axis, where the text label has the least tendency to overlap.
- # For data sorted in ascending order, a start angle of 45 degrees can be used instead.
- c.setStartAngle(135)
- # Output the chart
- c.makeChart("emojiicon_piechart.png")
See all these and more at ChartDirector 7.0 (Python Edition), Pie Chart Gallery, and ChartDirector website
0
TSSFL -- A Creative Journey Towards Infinite Possibilities!
-
- Similar Topics
- Replies
- Views
- Last post
-
- Information
-
Who is online
Users browsing this forum: No registered users and 3 guests