Projecting Mollview Maps into Different Coordinate Systems
Posted: Fri Jul 13, 2018 6:25 pm
Python Healpy and Matplotlib are useful tools for plotting and visualization of Mollweide projections. We can use these tools to convert between different Mollview maps, such as Galactic, Ecliptic, Equatorial (Celestial) coordinate systems. Such maps can be very useful in geographical studies that assume the celestial bodies. In Python Healpy (or HEALPIX in general), allowed coordinate systems are 'G' (galactic), 'E' (ecliptic) and 'C' (equatorial). Let's learn by few examples.
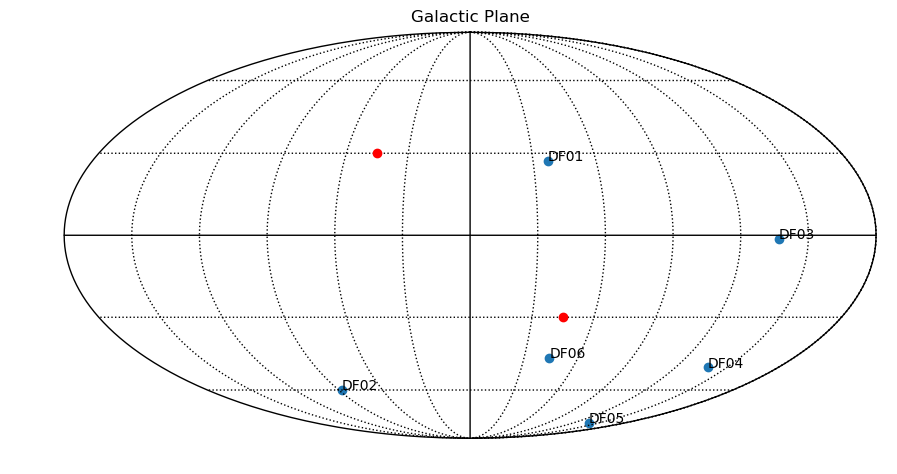
1. Draw a galactic plane and put some labels/objects specified by latitudes and longitudes
The output should be the galactic plane below
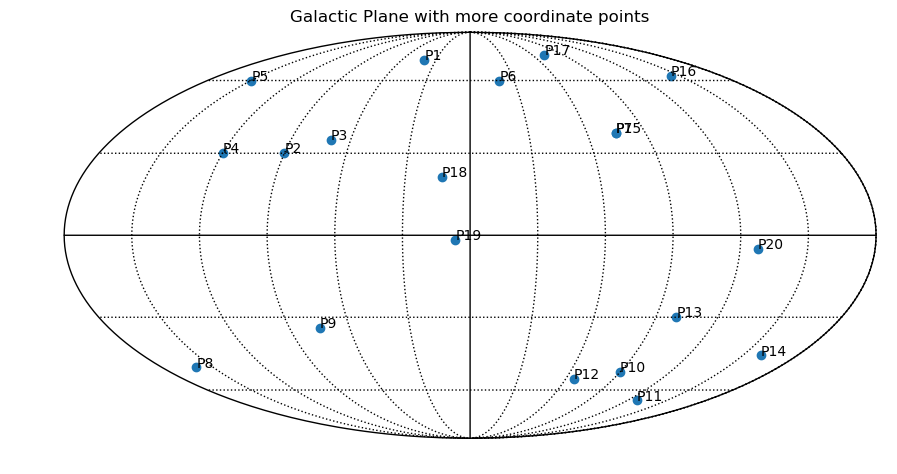
We can plot more or less similar galactic plane as the previous one but with more objects specified on it:
And here is the output
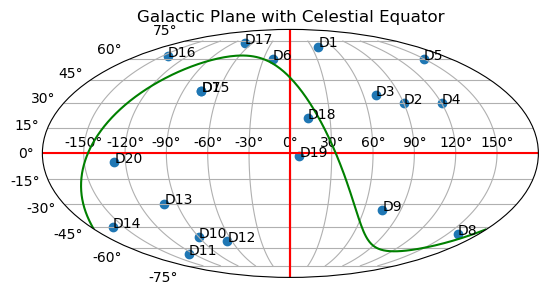
2. You can somehow sophisticate your code and draw a galactic plane, including celestial equator without even using Healpy - only Matplotlib/Pylab
The result is
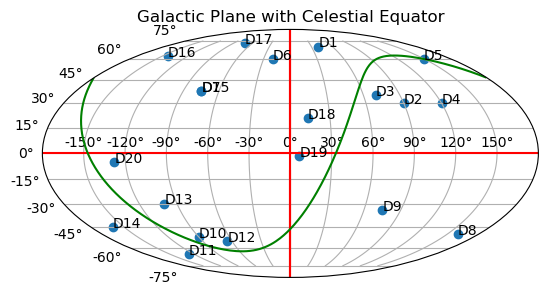
Change -latitude to latitude to have
The most important point to note here is, if using Healpy, you can convert between different coordinates by setting the appropriate options: (G[alactic], E[cliptic], C[elestial] or Equatorial=Celestial). Note also, positions are defined by latitudes and longitudes.
1. Draw a galactic plane and put some labels/objects specified by latitudes and longitudes
- import healpy as hp
- import numpy as np
- import matplotlib.pyplot as plt #You can import pylab as well
- hp.mollview(title="Galactic Plane", norm='hist', xsize=1000)
- hp.graticule()
- x = [-37, 88, -137, -139, -136, -44]
- y = [27, -60, -1.4, -50, -77, -46]
- lab = ['DF01', 'DF02', 'DF03', 'DF04', 'DF05', 'DF06' ]
- hp.projscatter(x, y, lonlat=True, coord="G")
- hp.projtext(-37., 27., 'DF01', lonlat=True, coord='G')
- hp.projtext(88, -60, 'DF02', lonlat=True, coord='G')
- hp.projtext(-137, -1.4, 'DF03', lonlat=True, coord='G')
- hp.projtext(-139, -50, 'DF04', lonlat=True, coord='G')
- hp.projtext(-136, -77, 'DF05', lonlat=True, coord='G')
- hp.projtext(-44, -46, 'DF06', lonlat=True, coord='G')
- equateur_lon = [-45.,45.]
- equateur_lat = [-30.,30.]
- hp.projplot(equateur_lon, equateur_lat, 'ro-', lonlat=True, coord='G')
- plt.savefig("galactic_plane.png", format='png', bbox_inches='tight')
The output should be the galactic plane below
We can plot more or less similar galactic plane as the previous one but with more objects specified on it:
- import healpy as hp
- import numpy as np
- import matplotlib.pyplot as plt
- hp.mollview(title="Galactic Plane with more coordinate points")
- hp.graticule()
- theta =np.array([40.,90.,70.,120.,150.,-20.,-75.,160.,75.,-90.,-127.,-65.,-100.,-160.,-75.,-143.,-72.,13,6.6,-128.])
- theta = theta.flatten()
- phi =np.array([70.,30.,35.,30.,60.,60.,38.,-50.,-34.,-52.,-65.,-55.,-30.,-45.,38.,62.,73.,21.,-1.77,-5])
- phi = phi.flatten()
- lab = ['P1', 'P2', 'P3', 'P4', 'P5', 'P6','P7', 'P8', 'P9', 'P10', 'P11', 'P12','P13', 'P14', 'P15', 'P16', 'P17', 'P18','P19', 'P20']
- hp.projscatter(theta, phi, lonlat=True, coord='G')
- hp.projtext(40., 70., 'P1', lonlat=True, coord='G')
- hp.projtext(90., 30., 'P2', lonlat=True, coord='G')
- hp.projtext(70., 35., 'P3', lonlat=True, coord='G')
- hp.projtext(120., 30., 'P4', lonlat=True, coord='G')
- hp.projtext(150., 60., 'P5', lonlat=True, coord='G')
- hp.projtext(-20., 60., 'P6', lonlat=True, coord='G')
- hp.projtext(-75., 38., 'P7', lonlat=True, coord='G')
- hp.projtext(160., -50., 'P8', lonlat=True, coord='G')
- hp.projtext(75., -34., 'P9', lonlat=True, coord='G')
- hp.projtext(-90., -52., 'P10', lonlat=True, coord='G')
- hp.projtext(-127., -65., 'P11', lonlat=True, coord='G')
- hp.projtext(-65., -55., 'P12', lonlat=True, coord='G')
- hp.projtext(-100., -30., 'P13', lonlat=True, coord='G')
- hp.projtext(-160., -45., 'P14', lonlat=True, coord='G')
- hp.projtext(-75., 38., 'P15', lonlat=True, coord='G')
- hp.projtext(-143., 62., 'P16', lonlat=True, coord='G')
- hp.projtext(-72., 73., 'P17', lonlat=True, coord='G')
- hp.projtext(13., 21., 'P18', lonlat=True, coord='G')
- hp.projtext(6.6, -1.77, 'P19', lonlat=True, coord='G')
- hp.projtext(-128., -5, 'P20', lonlat=True, coord='G')
- plt.savefig("galactic_plane_2.png", format='png', bbox_inches='tight')
And here is the output
2. You can somehow sophisticate your code and draw a galactic plane, including celestial equator without even using Healpy - only Matplotlib/Pylab
- import numpy as np
- import pylab as plt
- import math
- x =np.array([40.,90.,70.,120.,150.,-20.,-75.,160.,75.,-90.,-127.,-65.,-100.,-160.,-75.,-143.,-72.,13,6.6,-128.])
- x = x.flatten()
- y =np.array([70.,30.,35.,30.,60.,60.,38.,-50.,-34.,-52.,-65.,-55.,-30.,-45.,38.,62.,73.,21.,-1.77,-5])
- y = y.flatten()
- lab = ['D1', 'D2', 'D3', 'D4', 'D5', 'D6','D7', 'D8', 'D9', 'D10', 'D11', 'D12','D13', 'D14', 'D15', 'D16', 'D17', 'D18','D19', 'D20']
- #Plot the celestial equator in galactic coordinates
- degtorad = math.pi/180.
- alpha = np.arange(-180,180.,1.)
- alpha *= degtorad
- #From Meeus, Astronomical algorithms (with delta = 0)
- x1 = np.sin(192.25*degtorad - alpha)
- x2 = np.cos(192.25*degtorad - alpha)*np.sin(27.4*degtorad)
- yy = np.arctan2(x1, x2)
- longitude = 303*degtorad - yy
- x3 = np.cos(27.4*degtorad) * np.cos(192.25*degtorad - alpha)
- latitude = np.arcsin(x3)
- #We put the angles in the right direction
- for i in range(0,len(alpha)):
- if longitude[i] > 2.*math.pi:
- longitude[i] -= 2.*math.pi
- longitude[i] -= math.pi
- latitude[i] = -latitude[i]
- # To avoid a line in the middle of the plot (the curve must not loop)
- for i in range(0,len(longitude)-1):
- if (longitude[i] * longitude[i+1] < 0 and longitude[i] > 170*degtorad and longitude[i+1] < -170.*degtorad):
- indice = i
- break
- #The array is put in increasing longitude
- longitude2 = np.zeros(len(longitude))
- latitude2 = np.zeros(len(latitude))
- longitude2[0:len(longitude)-1-indice] = longitude[indice+1:len(longitude)]
- longitude2[len(longitude)-indice-1:len(longitude)] = longitude[0:indice+1]
- latitude2[0:len(longitude)-1-indice] = latitude[indice+1:len(longitude)]
- latitude2[len(longitude)-indice-1:len(longitude)] = latitude[0:indice+1]
- xrad = x * degtorad
- yrad = y * degtorad
- fig2 = plt.figure(2)
- ax1 = fig2.add_subplot(111, projection="mollweide")
- ax1.scatter(xrad,yrad)
- ax1.plot([-math.pi, math.pi], [0,0],'r-')
- ax1.plot([0,0],[-math.pi, math.pi], 'r-')
- ax1.plot(longitude2,latitude2,'g-')
- for i in range(0,20):
- ax1.text(xrad[i], yrad[i], lab[i])
- plt.title("Galactic Plane with Celestial Equator")
- plt.grid(True)
- plt.savefig("gal_celestial_e.png", format='png', bbox_inches='tight')
The result is
Change -latitude to latitude to have
The most important point to note here is, if using Healpy, you can convert between different coordinates by setting the appropriate options: (G[alactic], E[cliptic], C[elestial] or Equatorial=Celestial). Note also, positions are defined by latitudes and longitudes.