Combining Pandas and Plotly for Data Visualization

Post Reply
User avatar
Eli
Senior Expert Member
Reactions: 183
Posts: 5334
Joined: 9 years ago
Location: Tanzania
Has thanked: 75 times
Been thanked: 88 times
Contact:

#1

We will work you through an example of how to use Pandas and Plotly to visualize data. The aim of visualization is not numbers, but to get an insight and a feeling about the data. Pandas is a Python library that makes it easier to work with data - it offers functionalities that make data presentation, visualization and analysis pretty simple task. In this brief tutorial, we will use Plotly offline.

In our tutorial, we will work with the famous "Iris" dataset that is stored on the UCI machine learning repository.

The Iris dataset contains measurements for 150 Iris flowers from three different species.

The three classes, each with 50 measurements, in the Iris dataset are:

  1. Iris-setosa
  2. Iris-versicolor
  3. Iris-virginica
And the four features of each species in the Iris dataset are:

  1. sepal length in cm
  2. sepal width in cm
  3. petal length in cm
  4. petal width in cm
Loading the Iris dataset

We can download the Iris dataset from UCI repository and put it, say on the Desktop, then input the path to load it, but here we will use the pandas library and load the dataset directly from the UCI repository:

  1. import pandas as pds
  2. df = pds.read_csv(
  3.     filepath_or_buffer='https://archive.ics.uci.edu/ml/machine-learning-databases/iris/iris.data',
  4.     header=None,
  5.     sep=',')
  6.  
  7. df.columns=['sepal_length', 'sepal_width', 'petal_length', 'petal_width', 'class']
  8. df.dropna(how="all", inplace=True) # This drops the empty line at the file-end


We can respectively, print the first/last few rows of the dataset we loaded as follows:

  1. print(df.head())
  2.    sepal_length  sepal_width  petal_length  petal_width        class
  3. 0           5.1          3.5           1.4          0.2  Iris-setosa
  4. 1           4.9          3.0           1.4          0.2  Iris-setosa
  5. 2           4.7          3.2           1.3          0.2  Iris-setosa
  6. 3           4.6          3.1           1.5          0.2  Iris-setosa
  7. 4           5.0          3.6           1.4          0.2  Iris-setosa
  8.  
  9. print(df.tail())
  10.  sepal_length  sepal_width  petal_length  petal_width           class
  11. 145           6.7          3.0           5.2          2.3  Iris-virginica
  12. 146           6.3          2.5           5.0          1.9  Iris-virginica
  13. 147           6.5          3.0           5.2          2.0  Iris-virginica
  14. 148           6.2          3.4           5.4          2.3  Iris-virginica
  15. 149           5.9          3.0           5.1          1.8  Iris-virginica


Let's split the data table into data values X and class/species labels Y:

  1. X = df.ix[:,0:4].values
  2. Y = df.ix[:,4].values


The Iris dataset is now formated in form of a matrix where the columns are the different features, and every row represents a separate flower sample. Each sample row can be viewed as a 4-dimensional vector:

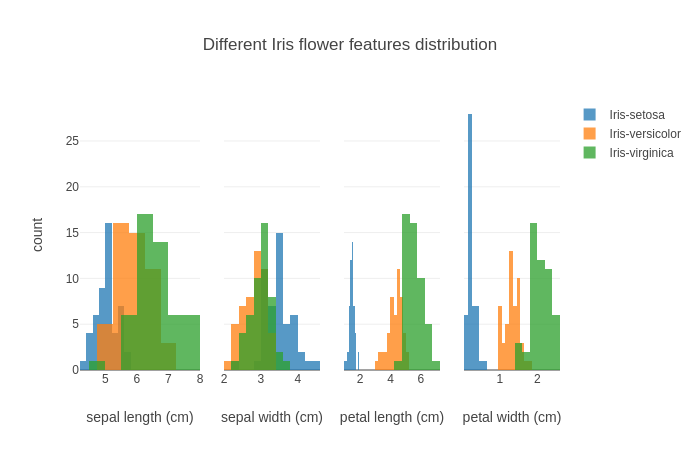
Finally, let's visualize our dataset using histograms:

  1. from plotly.graph_objs import *
  2.  
  3. traces = []
  4.  
  5. legend = {0:False, 1:False, 2:False, 3:True}
  6.  
  7. #You can choose other colors
  8. colors = {'Iris-setosa': 'rgb(31, 119, 180)',
  9.           'Iris-versicolor': 'rgb(255, 127, 14)',
  10.           'Iris-virginica': 'rgb(44, 160, 44)'}
  11.  
  12. for col in range(4):
  13.     for key in colors:
  14.         traces.append(Histogram(x=X[y==key, col],
  15.                         opacity=0.75,
  16.                         xaxis='x%s' %(col+1),
  17.                         marker=Marker(color=colors[key]),
  18.                         name=key,
  19.                         showlegend=legend[col]))
  20.  
  21. data = Data(traces)
  22.  
  23. layout = Layout(barmode='overlay',
  24.                 xaxis=XAxis(domain=[0, 0.25], title='sepal length (cm)'),
  25.                 xaxis2=XAxis(domain=[0.3, 0.5], title='sepal width (cm)'),
  26.                 xaxis3=XAxis(domain=[0.55, 0.75], title='petal length (cm)'),
  27.                 xaxis4=XAxis(domain=[0.8, 1], title='petal width (cm)'),
  28.                 yaxis=YAxis(title='count'),
  29.                 title='Different Iris flower features distribution')
  30.  
  31. #Use Plotly offline
  32. from plotly.offline import plot
  33.  
  34. fig = Figure(data=data, layout=layout)
  35. plot(fig)


The output is:

Image
0
TSSFL -- A Creative Journey Towards Infinite Possibilities!
User avatar
Eli
Senior Expert Member
Reactions: 183
Posts: 5334
Joined: 9 years ago
Location: Tanzania
Has thanked: 75 times
Been thanked: 88 times
Contact:

#2

Here is the full code, ix is deprecated and has been replaced by iloc. Run this code here:

  1. import pandas as pds
  2. from plotly.offline import plot
  3. from plotly.graph_objs import *
  4. import chart_studio.plotly as py
  5. py.sign_in('TSSFL', 'VIrC8tjxOn2nwujbiwrk') #Sign into TSSFL Plotly online
  6. df = pds.read_csv(
  7. filepath_or_buffer='https://archive.ics.uci.edu/ml/machine-learning-databases/iris/iris.data',
  8. header=None,
  9. sep=',')
  10.  
  11. df.columns=['sepal_length', 'sepal_width', 'petal_length', 'petal_width', 'class']
  12. df.dropna(how="all", inplace=True) # This drops the empty line at the file-end
  13.  
  14. X = df.iloc[:,0:4].values
  15. Y = df.iloc[:,4].values
  16.  
  17. traces = []
  18.  
  19. legend = {0:False, 1:False, 2:False, 3:True}
  20.  
  21. #You can choose other colors
  22. colors = {'Iris-setosa': 'rgb(31, 119, 180)',
  23.       'Iris-versicolor': 'rgb(255, 127, 14)',
  24.       'Iris-virginica': 'rgb(44, 160, 44)'}
  25.  
  26. for col in range(4):
  27.     for key in colors:
  28.         traces.append(Histogram(x=X[Y==key, col],
  29.                     opacity=0.75,
  30.                     xaxis='x%s' %(col+1),
  31.                     marker=Marker(color=colors[key]),
  32.                     name=key,
  33.                     showlegend=legend[col]))
  34. data = Data(traces)
  35.  
  36. layout = Layout(barmode='overlay',
  37.             xaxis=XAxis(domain=[0, 0.25], title='sepal length (cm)'),
  38.             xaxis2=XAxis(domain=[0.3, 0.5], title='sepal width (cm)'),
  39.             xaxis3=XAxis(domain=[0.55, 0.75], title='petal length (cm)'),
  40.             xaxis4=XAxis(domain=[0.8, 1], title='petal width (cm)'),
  41.             yaxis=YAxis(title='count'),
  42.             title='Different Iris flower features distribution')
  43.  
  44. #Use Plotly offline
  45. fig = Figure(data=data, layout=layout)
  46. plot(fig)
  47.  
  48. #Upload the plot into Plotly Online
  49. plot_url = py.plot(fig, filename='Iris_data_plot.png')


The HTML based output will look like this:
Attachments
Iris_plot.png
0
TSSFL -- A Creative Journey Towards Infinite Possibilities!
Post Reply

Return to “Plotly”

  • Information
  • Who is online

    Users browsing this forum: No registered users and 3 guests